Random Forest
Tags
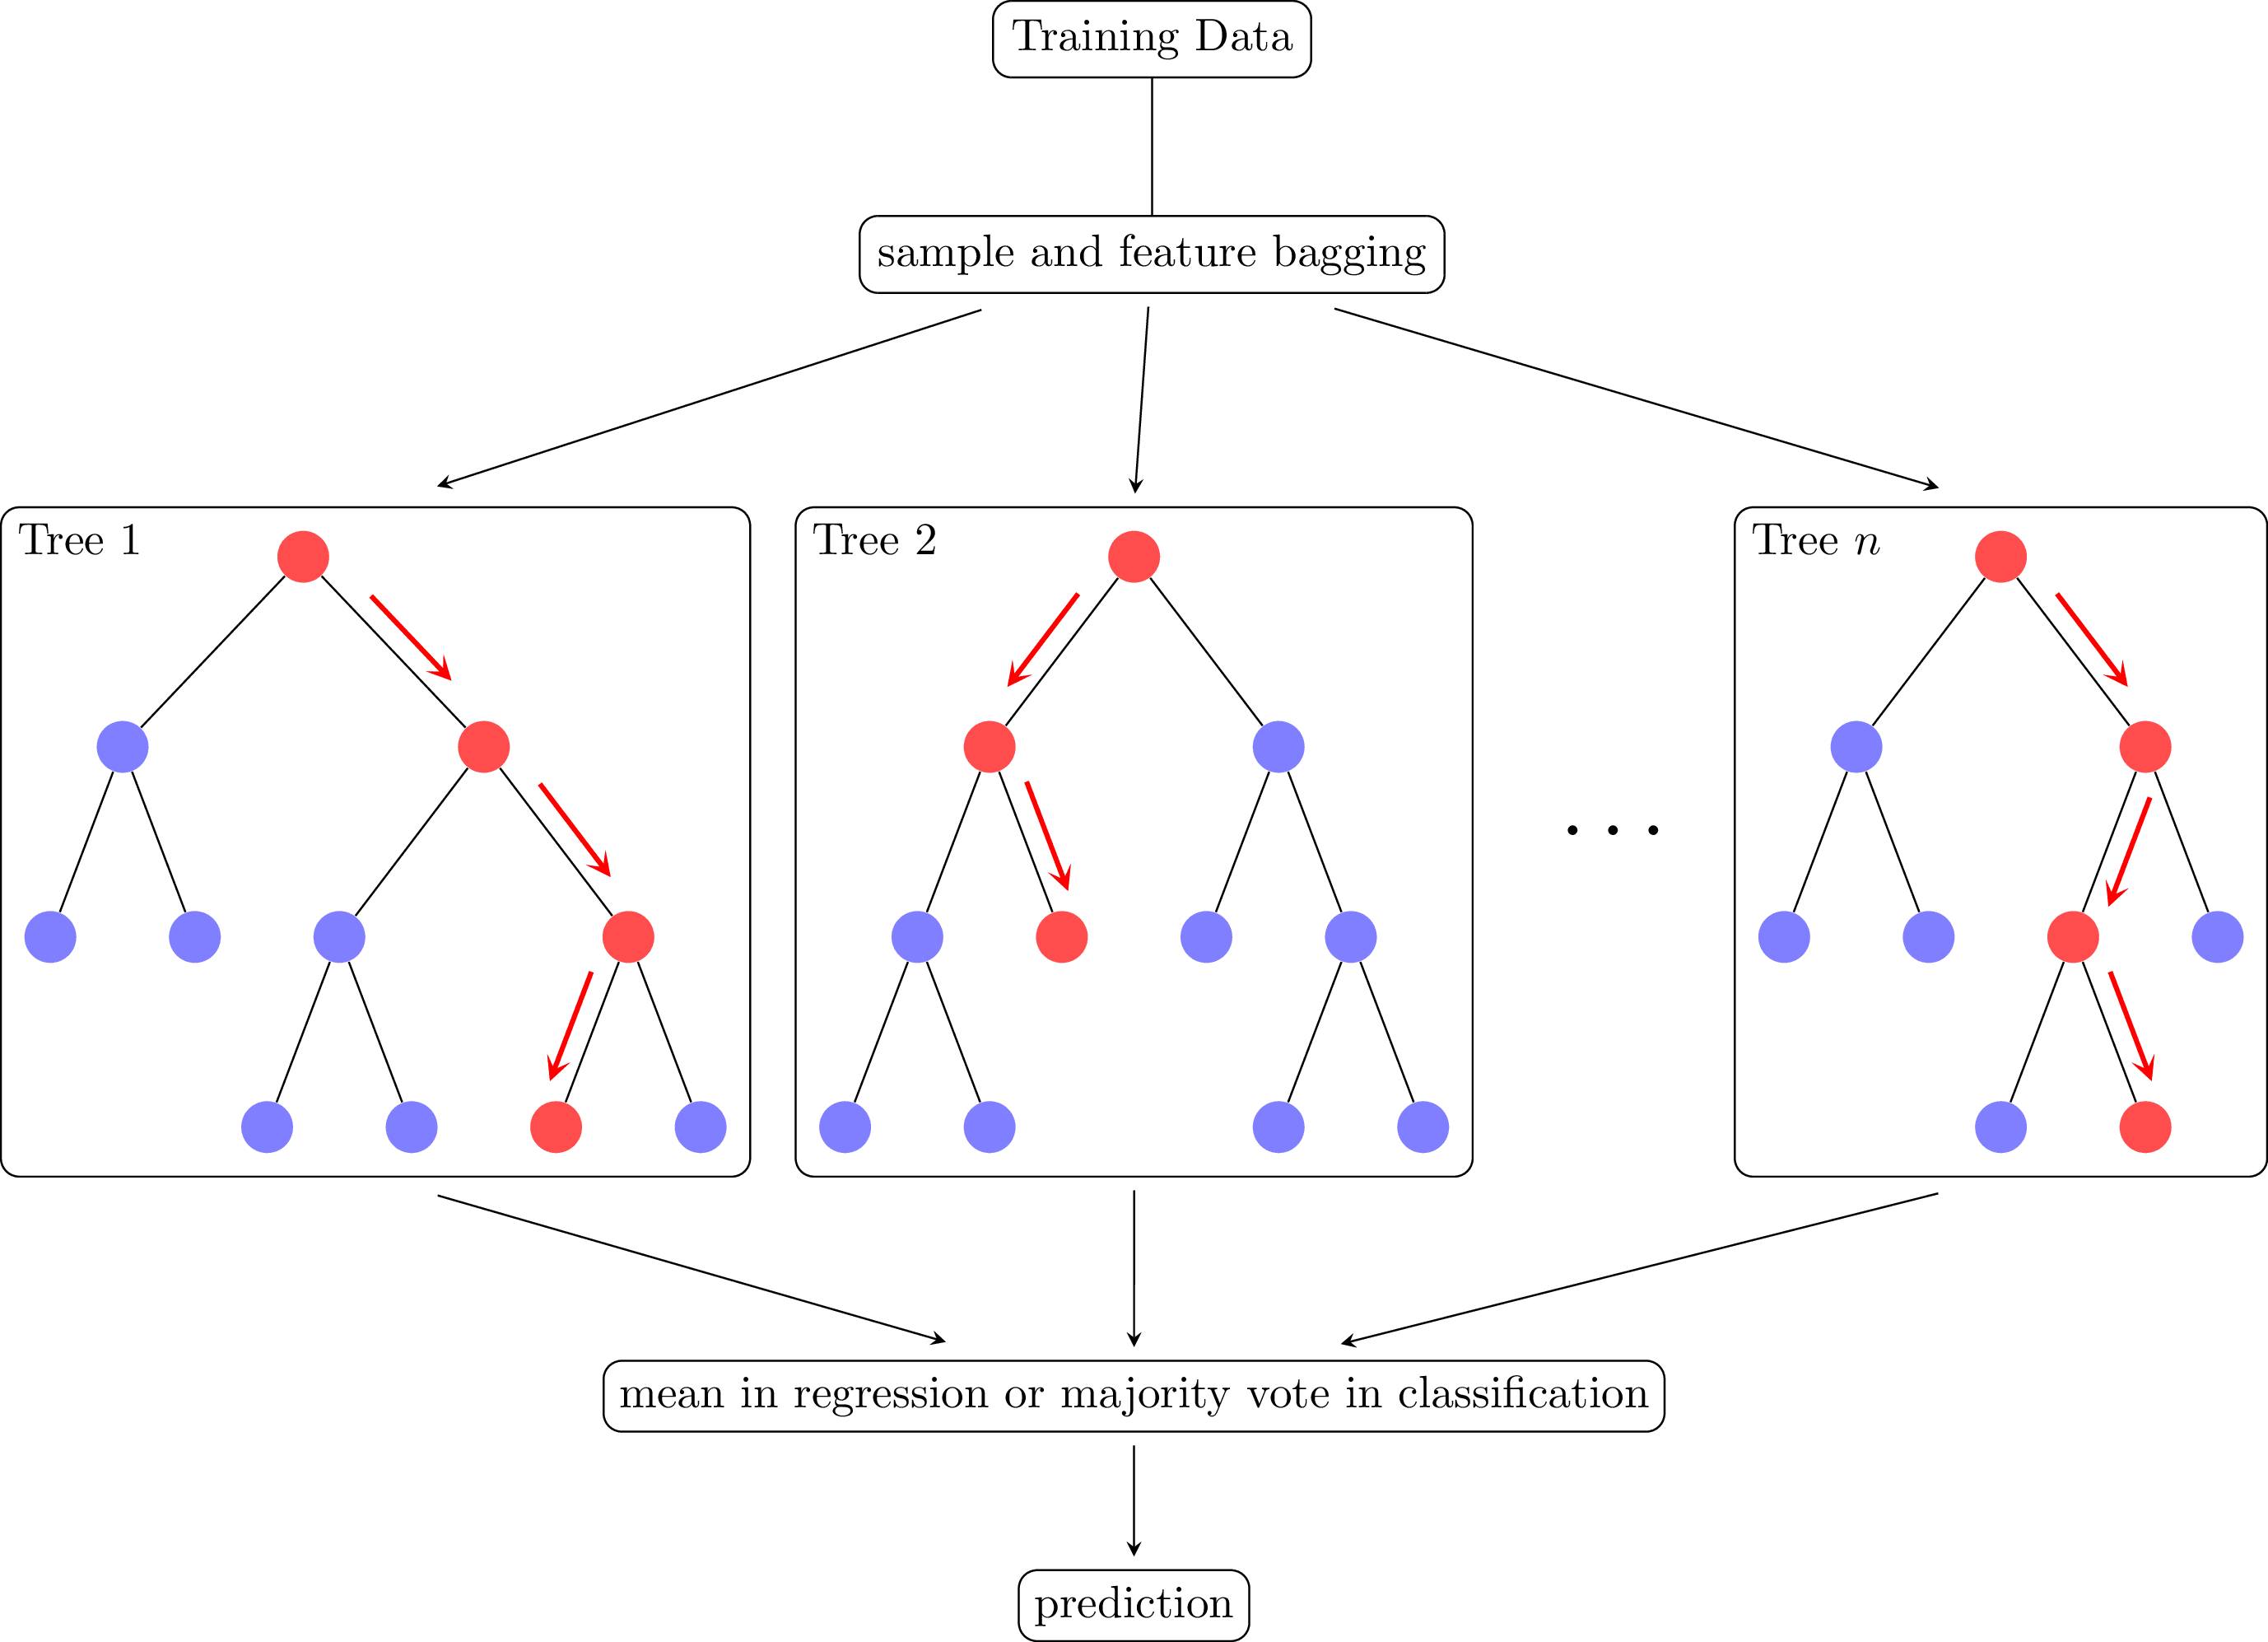
Diagram of the random forest (RF) algorithm (Breiman 2001). RFs are ensembles model consisting of binary decision trees that predicts the mode of individual tree predictions in classification or the mean in regression. Every node in a decision tree is a condition on a single feature, chosen to split the dataset into two so that similar samples end up in the same set. RFs are inspectable, invariant to scaling and other feature transformations, robust to inclusion of irrelevant features and can estimate feature importance via mean decrease in impurity (MDI).

Edit
Download
Code
random-forest.tex (45 lines)
\documentclass[tikz]{standalone}

\usepackage{forest}
\usetikzlibrary{fit,positioning}

\tikzset{
  red arrow/.style={
    midway,red,sloped,fill, minimum height=3cm, single arrow, single arrow head extend=.5cm, single arrow head indent=.25cm,xscale=0.3,yscale=0.15,
    allow upside down
  },
  black arrow/.style 2 args={-stealth, shorten >=#1, shorten <=#2},
  black arrow/.default={1mm}{1mm},
  tree box/.style={draw, rounded corners, inner sep=0.5em},
  node box/.style={white, draw=black, text=black, rectangle, rounded corners},
}

\begin{document}
\begin{forest}
  for tree={l sep=3em, s sep=2em, anchor=center, inner sep=0.4em, fill=blue!50, circle, where level=2{no edge}{}}
  [
  Training Data, node box
  [sample and feature bagging, node box, alias=bagging, above=3em
  [,red!70,alias=a1[[,alias=a2][]][,red!70,edge label={node[above=1ex,red arrow]{}}[[][]][,red!70,edge label={node[above=1ex,red arrow]{}}[,red!70,edge label={node[below=1ex,red arrow]{}}][,alias=a3]]]]
  [,red!70,alias=b1[,red!70,edge label={node[below=1ex,red arrow]{}}[[,alias=b2][]][,red!70,edge label={node[above=1ex,red arrow]{}}]][[][[][,alias=b3]]]]
  [~~~$\dots$~,scale=2,no edge,fill=none,yshift=-3em]
  [,red!70,alias=c1[[,alias=c2][]][,red!70,edge label={node[above=1ex,red arrow]{}}[,red!70,edge label={node[above=1ex,red arrow]{}}[,alias=c3][,red!70,edge label={node[above=1ex,red arrow]{}}]][,alias=c4]]]]
  ]
  \node[tree box, fit=(a1)(a2)(a3)] (t1) {};
  \node[tree box, fit=(b1)(b2)(b3)] (t2) {};
  \node[tree box, fit=(c1)(c2)(c3)(c4)] (tn) {};
  \node[below right=0.5em, inner sep=0pt] at (t1.north west) {Tree 1};
  \node[below right=0.5em, inner sep=0pt] at (t2.north west) {Tree 2};
  \node[below right=0.5em, inner sep=0pt] at (tn.north west) {Tree $n$};
  \path (t1.south west)--(tn.south east) node[midway,below=4em, node box] (mean) {mean in regression or majority vote in classification};
  \node[below=3em of mean, node box] (pred) {prediction};
  \draw[black arrow={5mm}{4mm}] (bagging) -- (t1.north);
  \draw[black arrow] (bagging) -- (t2.north);
  \draw[black arrow={5mm}{4mm}] (bagging) -- (tn.north);
  \draw[black arrow={5mm}{5mm}] (t1.south) -- (mean);
  \draw[black arrow] (t2.south) -- (mean);
  \draw[black arrow={5mm}{5mm}] (tn.south) -- (mean);
  \draw[black arrow] (mean) -- (pred);
\end{forest}
\end{document}